For more than 30 years, the Public School Forum of North Carolina’s Local School Finance Study has highlighted variations and trends in local spending for public education across our state’s 100 counties. The purpose of this annual study is to isolate local spending from state and federal spending to examine the capacity and actual effort of counties to support public schools. The Local School Finance Study focuses not only on the amount that counties spend on schools, but also on each county’s investment in relation to their taxable resources. Note: the data presented in the most recent study are from the 2023-24 school year.
Local School Finance at a Glance

School Funding Disparities
In recent years, our annual studies have consistently identified several key trends that have led to deepened educational inequity across districts over time. First, there is a large and widening gap between wealthier counties and those with lower levels of wealth. As a result, there are significant disparities in the ability of counties with different levels of wealth to provide their schools with the resources they need, particularly given the increasing role of local spending over time. We have also found that lower wealth counties tax themselves at higher rates than wealthier counties, but are still unable to generate comparable tax revenue to wealthier counties that make less taxing effort. The ten poorest districts taxed themselves at 1.8 times the average tax rate of the ten wealthiest counties in 2023-24. Residents living in lower wealth districts face substantially greater financial burden to support public education while still finding that their schools are more poorly resourced than those in wealthier counties.
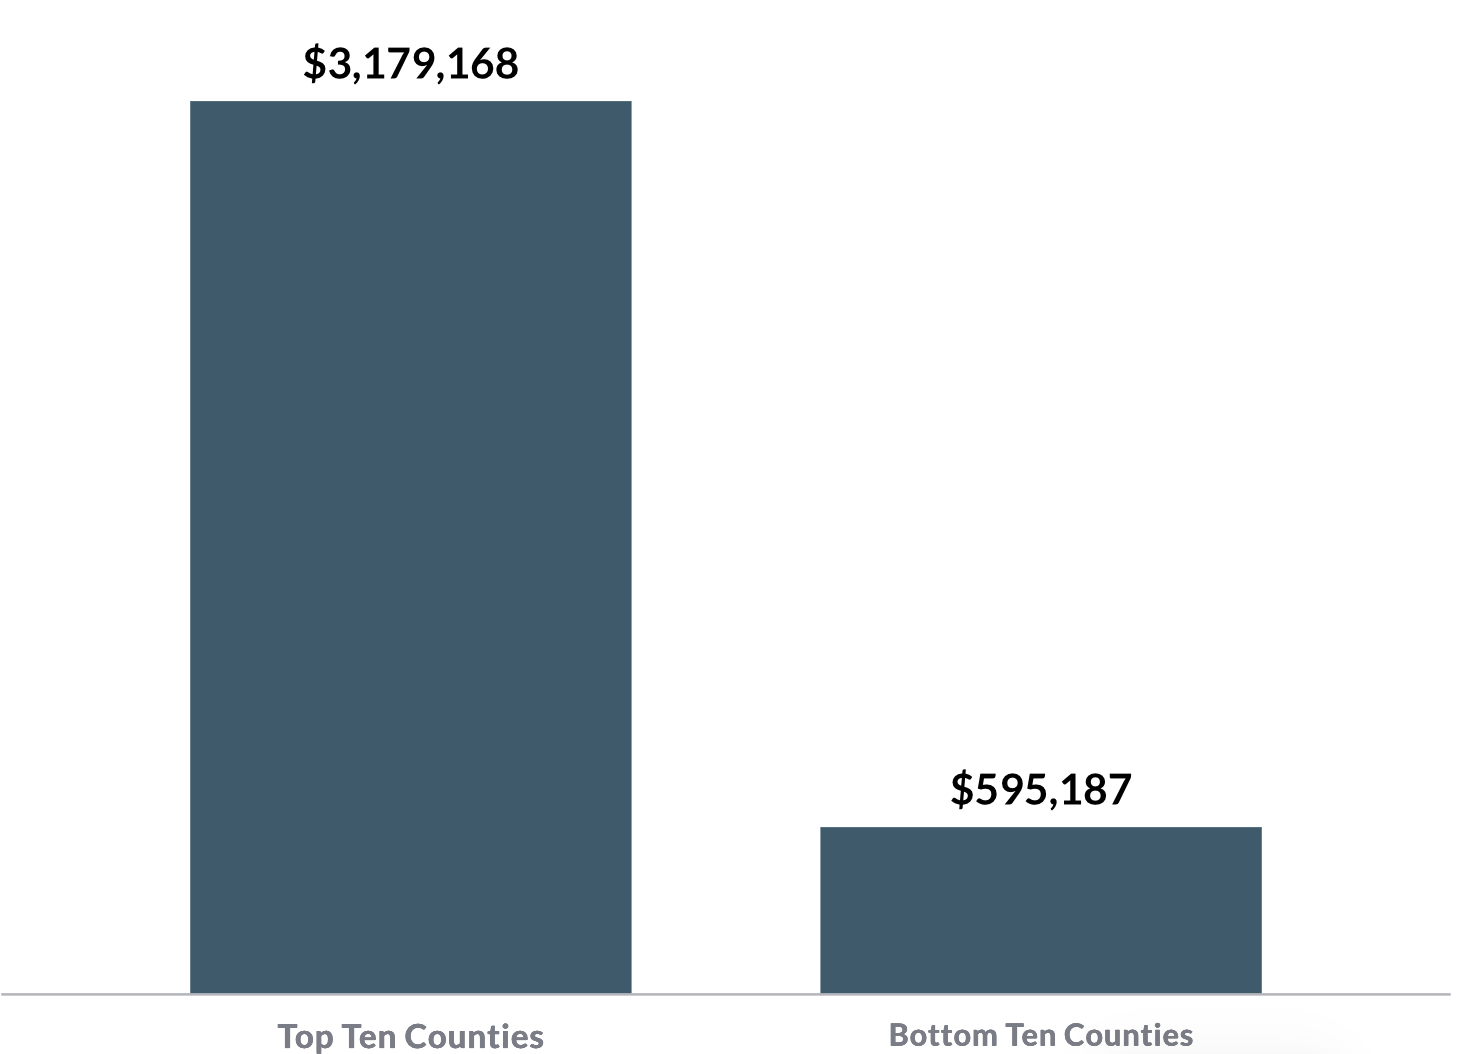
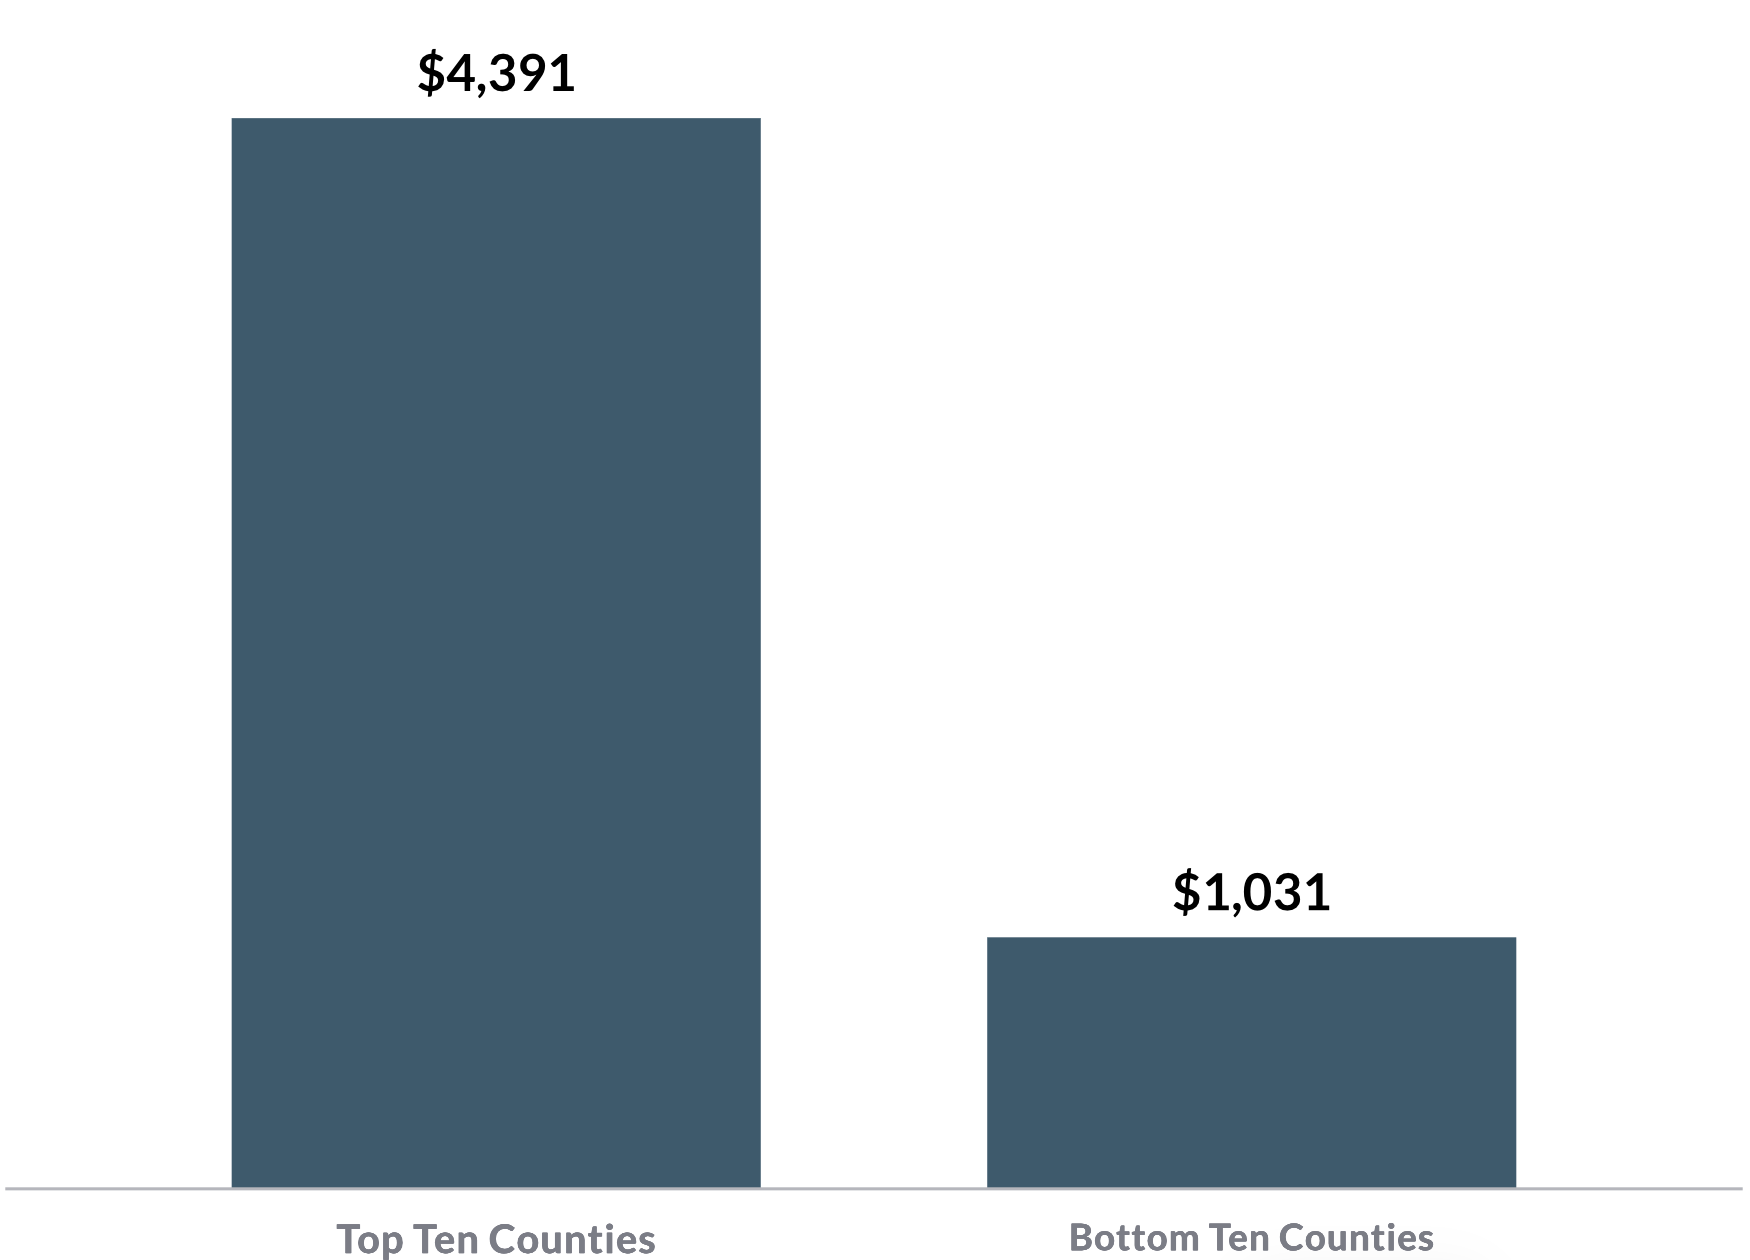
In 2023-24, the top 10 wealthiest counties had a tax base $2,583,981 greater than the 10 poorest counties. At the same time, the ten highest spending counties spent on average $4,391 per student compared to $1,031 by the ten lowest spending counties, a gap of $3,360 per student.
Real Estate Wealth per Student
Average Local Spending per Student
In 2023-24, Orange County, the highest spending county in the state, spent $456 more per student than the seven lowest spending counties combined.

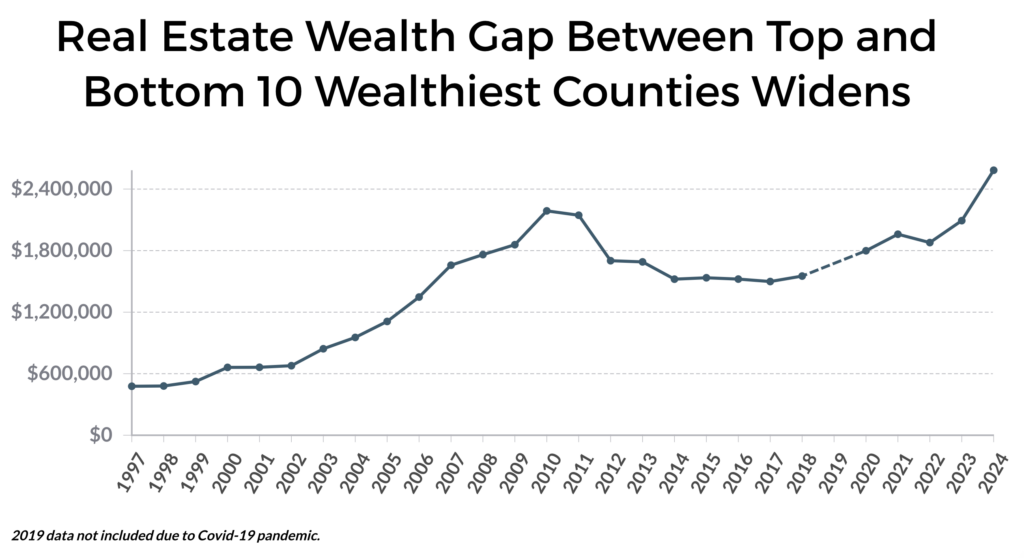
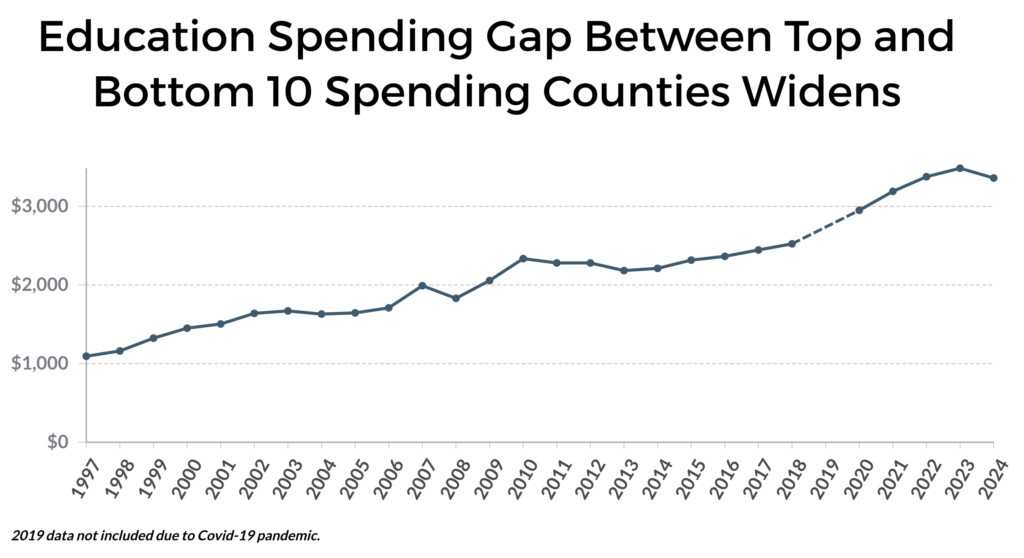
The wealth gap and spending gap have both grown significantly since 1997 when the Forum first began tracking these disparities. Since 1997, the wealth gap has grown over 400% from $477,477 to nearly $2.6 million, while the spending gap has grown over 300% from $1,094 to over $3,300.
North Carolina Teachers
One of the most notable impacts of inadequate and inequitable funding for education is that low-wealth school districts have a harder time attracting and retaining high quality and experienced teachers due to their inability to offer competitive salary supplements like those offered in wealthier counties. For instance, in 2023-24, Wake County Schools offered its teachers an average locally-funded salary supplement of $9,828. Just 60 miles east, Greene County, a lower-wealth, rural district that taxes itself at a higher rate than Wake County in an effort to adequately fund its schools, teachers received an average supplement of $1000 in the same year.
In 2021, the General Assembly established the Teacher Supplement Assistance Allotment to provide additional teacher salary supplements of up to $4,250. The state provides this funding in an effort to close the large disparities in teacher supplements between richer and poorer counties. The amounts vary by county and the program targets rural and low-wealth areas.
The table below includes only the local salary supplement, and does not include the additional salary supplement provided by the state. More information on the state appropriations for the teacher salary supplement can be found here.
